Adding Maps to PortalJS: Enhancing Geospatial Data Visualization with PortalJS

João Demenech

Luccas Mateus

Yoana Popova
This post walks you though adding maps and geospatial visualizations to PortalJS.
Are you interested in building rich and interactive data portals? Do you find value in the power and flexibility of JavaScript, Nextjs, and React? If so, PortalJS is for you. It's a state-of-the-art framework leveraging these technologies to help you build rich data portals.
Effective data visualization lies in the use of various data components. Within PortalJS, we take data visualization a step further. It's not just about displaying data - it's about telling a story through combining a variety of data components.
In this post we will share our latest enhancement to PortalJS: maps, a powerful tool for visualizing geospatial data. In this post, we will to take you on a tour of our experiments and progress in enhancing map functionalities on PortalJS. The journey is still in its early stages, with new facets being unveiled and refined as we perfect our API.
Exploring Map Formats
Maps play a crucial role in geospatial data visualization. Several formats exist for storing and sharing this type of data, with GeoJSON, KML, and shapefiles being among the most popular. As a prominent figure in the field of open-source data portal platforms, PortalJS strives to support as many map formats as possible.
Taking inspiration from the ckanext-geoview extension, we currently support KML and GeoJSON formats in PortalJS. This remarkable extension is a plugin for CKAN, the world’s leading open source data management system, that enables users to visualize geospatial data in diverse formats on an interactive map. Apart from KML and GeoJSON formats support, our roadmap entails extending compatibility to encompass all other formats supported by ckanext-geoview. Rest assured, we are committed to empowering users with a wide array of map format options in the future.
So, what makes these formats special?
- GeoJSON: This format uses JSON to depict simple geographic features and their associated attributes. It's often hailed as the most popular choice in the field.
- KML: An XML-based format, KML can store details like placemarks, paths, polygons, and styles.
- Shapefiles: These are file collections that store vector data—points, lines, and polygons—and their attributes.
Unveiling the Power of Leaflet and OpenLayers
To display maps in PortalJS, we utilize two powerful JavaScript libraries for creating interactive maps based on different layers: Leaflet and OpenLayers. Each offers distinct advantages (and disadvantages), inspiring us to integrate both and give users the flexibility to choose.
Leaflet is the leading open-source JavaScript library known for its mobile-friendly, interactive maps. With its compact size (just 42 KB of JS), it provides all the map features most developers need. Leaflet is designed with simplicity, performance and usability in mind. It works efficiently across all major desktop and mobile platforms.
OpenLayers is a high-performance library packed with features for creating interactive web maps. OpenLayers can display map tiles, vector data, and markers sourced from anywhere on any webpage. It's an excellent tool for leveraging geographic information of all kinds.
Introducing Map Feature
Both components have some similar features and props, such as:
Polygons and points
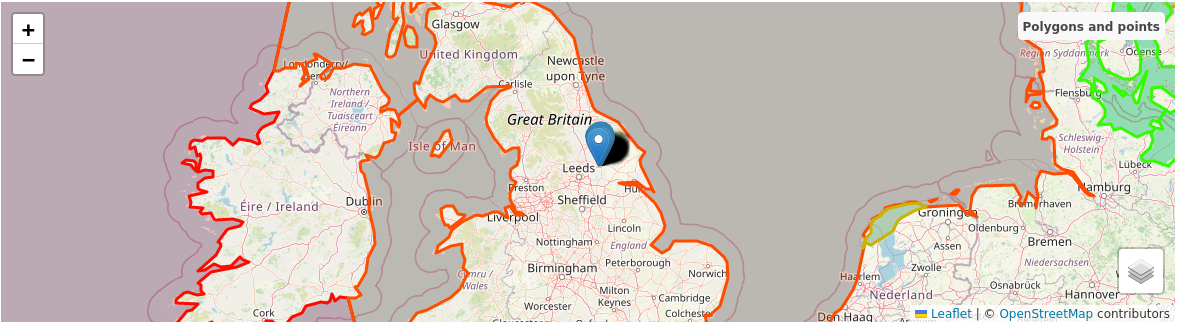
Our initial version enables the use of both vectors and points to display information. Points are simpler and faster to render than vectors, but they have less detail and interactivity. For example, if you have data that is represented by coordinates or addresses, you can use points to show them on the map. This way, you can avoid time-consuming loading and rendering complex vector shapes that may slow down your map.
Tooltips
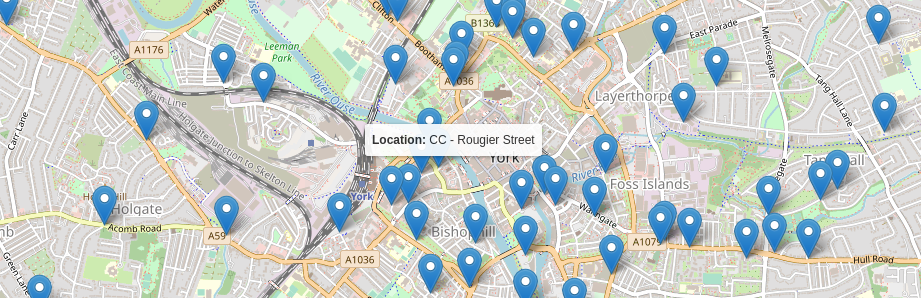
We have implemented an exciting feature that enhances the usability of our map component: tooltips. When you hover over a polygon or point on the map, a small pop-up window, known as a tooltip, appears. This tooltip provides relevant details about the feature under your cursor, according to what features the map creator wants to highlight. For example, when exploring countries, you can effortlessly discover their name, population, and area by hovering over them. Similarly, hovering over cities reveals useful information like their name, temperature, and elevation. To enable this handy tooltip functionality on our map, simply include a tooltip prop when using the map component.
Focus
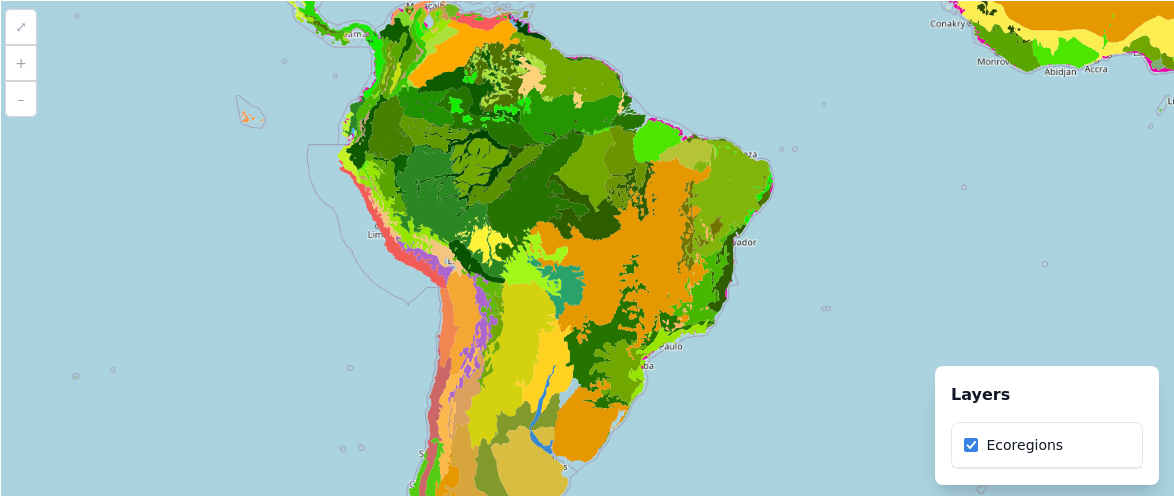
Users can also choose a region of focus, which will depend on the data, by setting initial center coordinates and zoom level. This is especially helpful for maps that are not global, such as the ones that use data from a specific country, city or region.
Mapping the Future with PortalJS
Through our ongoing enhancements to the PortalJS library, we aim to empower users to create engaging and informative data portals featuring diverse map formats and data components.
Why not give PortalJS a try today and discover the possibilities for your own data portals? To get started, check out our comprehensive documentation here: PortalJS Documentation.
Have questions or comments about using PortalJS for your data portals? Feel free to share your thoughts on our Discord channel. We're here to help you make the most of your data.
Stay tuned for more exciting developments as we continue to enhance PortalJS!